Showing posts with label DIY. Show all posts

Tuesday, 19 April 2016

More CANAPE - how to restrict your cluster analysis to groups with significant endemism

Two previous posts described more of the background to the CANAPE analysis and how to do it yourself.

[[  2017-08-10 UPDATE - the second part of the condition used an incorrect index name, so the clustering only applied to the palaeo and some of the mixed cells.  This has been corrected in the post.  ]]


What was not covered in those posts was the final step in the Mishler et al. (2014) paper in which the cells classified as palaeo- neo- or mixed-endemism under the CANAPE scheme were clustered to identify groupings with shared branches from the tree.

The aim of this post is to fill that gap.


The way it is done is conceptually simple.  We just need to constrain the cluster analysis to only use cells that are identified as having significant phylogenetic endemism.  The way it is done takes just a few steps, and a bit of typing.


Analyses in Biodiverse can be constrained to work only on a subset of groups (cells) using a definition query (the same as a "where clause" used in database queries).  The way it is currently done is a little more involved than is ideal, largely due to the amount of typing needed, but is not too complex to get working.  (One day we will develop a spatial conditions builder interface to make spatial conditions easier).

So, imagine you have run a spatial analysis called "phylo_end" in which you have told the system to calculate the indices under the  Phylogenetic Endemism and Relative Phylogenetic Endemism, type 2 calculations.  You then ran 999 iterations of a randomisation called CANAPE to assess how often the observed index values were higher than random.  The spatial results object now has an additional list called CANAPE>>SPATIAL_RESULTS which contains the counts of how often the observed value was higher than the randomised values, how many iterations were applied for each index, how many ties there were, and the proportion that were higher than random.  (See the help for more details about the naming scheme).


An example of the setup for the randomisation.
The randomisations have been completed so now the spatial analysis has an output list called CANAPE>>SPATIAL_RESULTS.  This list contains indices that summarise how often the observed values were higher than (or tied with) those calculated using the randomised data.


The next step is to start a new cluster analysis and set our definition query.  The selected basedata has a randomisation output, so you will be warned about possible issues with synchronisation.  This is only a potential problem if you run more iterations of the randomisation, which is not the case here so you can safely ignore the warning.

You will see this warning when you open a new cluster analysis, but can ignore it in this case.  


Set the Metric to be PHYLO_JACCARD (or whatever metric you like - it is your analysis after all) and enter the text below in the Definition Query box (you will need to expand it to enter text).  If your output and randomisation names differ then edit the text as appropriate.

sp_get_spatial_output_list_value (
    output => 'phylo_end', 
    list   => 'CANAPE>>SPATIAL_RESULTS', 
    index  => 'P_PE_WE'
) > 0.95
|| 
sp_get_spatial_output_list_value (
    output => 'phylo_end', 
    list   => 'CANAPE>>SPATIAL_RESULTS', 
    index  => 'P_PHYLO_RPE_NULL2'
) > 0.95


What this does is use the sp_get_spatial_output_list_value() subroutine to access the randomisation indices.  If either of the PE scores for a group using the observed or alternate trees are higher than the randomisations for 95% of iterations (these are the P_PE_WE and P_RPE_NULL2 indices) then that group will pass the test. Only those groups (cells) that pass the test will be considered for the cluster analysis.

Example of the cluster analysis setup, with a definition query specified.  Only those groups (cells) that pass the test will be used in the cluster analysis.
(The text in the image is different from the main text only in whitespace and formatting.  The code is the same).    

Once the analysis is run it will look something like the image below.
Completed cluster analysis.  Cells that failed the definition query were not considered for clustering and are plotted in grey.  
And there it is, a cluster analysis of the CANAPE regions to identify which ones have similar sets of branches from the tree.

Of course, definitions queries are extremely versatile and can be used for all sorts of applications.  You might, for example, want to cluster within a region defined by a shapefile but consider geographic ranges from across a broader study region.

It is also worth noting that spatial analyses can use definition queries, but they affect the analysis differently.  Calculations will only be completed for groups that pass the definition query, but those groups can have neighbours that fail the definition query.  This allows one to more easily analyse data with larger window sizes but with a guard area (data on the edges of the analysis region which, if not considered, could cause biased results).


Shawn Laffan, 19-Apr-2016


For more details about Biodiverse, see http://purl.org/biodiverse

To see what else Biodiverse has been used for, see https://purl.org/biodiverse/wiki/PublicationsList

You can also join the Biodiverse-users mailing list at http://groups.google.com/group/Biodiverse-users

Thursday, 20 November 2014

Do it yourself CANAPE

[[ Update 2022-10-25:  Biodiverse now calculates CANAPE for you, so steps 4-6 below are not needed to generate CANAPE maps and data.  See more details in this blog post. ]]


In the previous blog post I described some of methods behind the CANAPE (Categorical Analysis of Neo and Palaeo Endemism) method.

The purpose of this post is to give more details about how to run it with your own data.  You can also use the Biodiverse pipeline, but these instructions focus on how to do it using the Biodiverse GUI (at least to the point of generating all the necessary data). 

These instructions assume you have already imported all your data, so both the species distribution data and the tree.  Instructions for how to do so are in the quick start guide.

The CANAPE analyses also need a version later than 0.19, which at the time of writing is the development version 0.99_005. [Update 2015-04-20 - version 1.0 has now been released http://purl.org/biodiverse/wiki/Downloads ]

Step 1.  View the data

This is a general step you should always do anyway, but open the View Labels tab so you can cross check the spatial data (the basedata object in Biodiverse parlance) and the tree.  This is accessed by the menu option Basedata->View Labels, the keyboard shortcut Shift-Control-V, or by double clicking on the basedata object in the outputs tab. 

As you hover over cells on the map (cells are called groups in Biodiverse) you should see paths on the tree being highlighted.  As you hover over branches on the tree you should see cells being highlighted.  If you click on cells or branches then species names (labels) in the list at the top left should be highlighted.

Hovering over a cell highlights any branches on the tree that are found in that cell. 


Hovering over a branch highlights the set of cells containing any of the named branches beneath it (usually just the terminals).  Clicking on the branch will also select the matching labels in the list at the top left, and colour all cells in the map based on how many of those labels are found in the associated group. 

If there is no highlighting then there is a mismatch between your tree and the basedata.  You will need to either rename the labels, for which there is an option in the basedata menu, or re-import the tree and specify a remap table when you do so.  Both approaches can use the same table, so it is up to you which data set should be the canonical source of names.  It does not matter which one is canonical for CANAPE, but for other analyses it can do.  It depends on what you want to do with the data.

Step 2.  Run the spatial analyses

The next step is to run the calculations for the observed data.  This uses a spatial analysis, and can be run using menu option Analyses->Spatial.  You should see something like the image below.  Make sure the tree you want to use is selected. 

The initial spatial analysis window with default spatial conditions. 

We now need to change the settings.  For this particular analysis we are only interested in each group (cell) in isolation, not collections of groups, so we need to delete the second spatial condition.

We also need to select the Phylogenetic Endemism calculation.  This can be accessed under the Phylogenetic Endemism category (or Phylogenetic Indices if you are using a version earlier than 0.99_005, but remember that CANAPE won't work on version 0.19 since it lacks the next set of calculations).  Then select the Relative Phylogenetic Endemism, type 2 calculation under the Phylogenetic Indices (relative) category.

Delete the second spatial condition and select the Phylogenetic Endemism calculation.


Also select the Relative Phylogenetic Endemism, type 2 calculation. 

When all is selected, hit the Go! button.  The example data set distributed with Biodiverse will take very little time to run.  The data set used in Mishler et al. (2014) takes approximately 5 seconds on a modern laptop.  (The code includes a number of optimisations such as caching of results for later re-use and binary searches where possible).

Step 2.  View the results

Now you get to bask in the glory of a set of results.

Screenshots of the example data are given in the previous blog post so won't be repeated here.  See the section "Step 1" at this URL:   http://biodiverse-analysis-software.blogspot.com.au/2014/11/canape-categorical-analysis-of-palaeo.html

It is time to stop basking and get back to work.

Step 3.  Run the randomisations


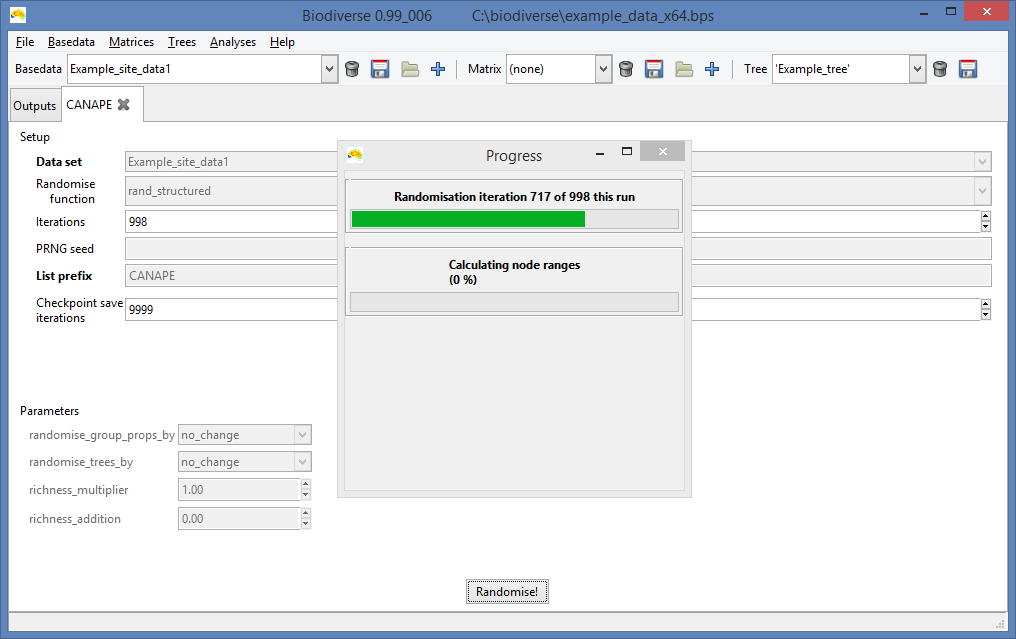
To assess which of the cells are candidates for palaeo- or neo-endemism we need to run a randomisation.  In this case we select the rand_structured option in Biodiverse, constraining the richness of each group (cell) to be equal across all randomisations.

CANAPE uses the rand_structured randomisation to ensure the richness of each cell is constant across all randomisation iterations/realisations. 

In the screen shot above you can see in the Setup section that we have chosen the rand_structured function for the randomisation.  We will run 999 iterations with all results being prefixed with "CANAPE".  See the Biodiverse help system for more details on the naming scheme.  The checkpoint save iterations is useful when one wishes to track a long running randomisation process to see if it has converged.  The basedata will be saved at any iteration ending in the value given will be saved, so a setting of 99 means iteration 99, 199, 299 etc will be saved.  It is probably not needed here, so can be set to 999.  [[EDIT 2020-Feb-19:  The checkpoints were used when we had crashes due to memory leaks.  These were fixed in version 0.18.  Unless you was to see how the system is progressing, the checkpoint save option can be set to -1 so it never happens.]]

The Parameters section allows us to control other options.  In this case we will leave the trees alone (randomise_trees_by equals no_change), so each analysis across the random iterations will use the original tree (for other analyses one might choose to randomise the tree but not the spatial data).  We have no group properties set so can also leave randomise_group_props_by as no_change.  A richness_multiplier of 1 and richness_addition of 0 means we will replicate the exact richness scores, as the formula used is a linear function (max_random_richness = observed_richness * richness_multiplier + richness_addition).


Now we hit the Go! button again.  This might take a while, depending on how large your data set is.  For the example data it is about 3 minutes on a modern laptop, but it can scale to hours for data sets of the size used in Mishler et al. (2014).

Unsurprisingly, the progress bar displays how progress has been made.


Step 4.  View the randomisation results 

This is another case of "the images are in the previous blog post".  Look for step 2 in http://biodiverse-analysis-software.blogspot.com.au/2014/11/canape-categorical-analysis-of-palaeo.html  (but note that those images use a randomisation name of Rand1 instead of CANAPE).


Step 5.  Export the results 


Exporting the results in Biodiverse version 0.99_005 and later can be done while viewing the spatial output (see this previous blog post), or from the outputs tab.  In earlier versions exporting can only be done from the outputs tab. 

The screenshot below shows the export options.  If you are using the Biodiverse pipeline then you need to export to delimited text format files.  If you are going to hand roll your classification then use whichever format is appropriate. 

Choose the export option most appropriate to your needs. 


Export the SPATIAL_RESULTS list.  This contains all the PE and RPE results.  This image is for the Delimited text method.  Some options will differ for other export methods. 

Export the randomisation results. 
The delimited text exports can be viewed in a spreadsheet program or imported into a stats package such as R. 
The results are in two tables (one for the spatial analyses, one for the randomisation results) so might need to be linked.  Use the Element field in each table for this, as it is the unique identifier for each group (in Biodiverse a group is jut a special type of element, as is a label).  The Axis_0 and Axis_1 fields are the coordinates of the cell centroids.  There can be any number of axis columns in a basedata, but in this case we have only two.  Remember that the randomisation naming scheme is explained here. 

If you export to one of the raster formats (except the ER-Mapper format) then you will have one raster per list item, so one for PE_WE_P, one for RPE_NULL2, etc.  The ER-Mapper format packs all of one list into one multiband raster, with one band per list item.

Step 6.  Classify the data 

The next step is to classify the data into neo, palaeo and mixed-endemism. Blow-by-blow details of that will be left to another blog post, as this one is getting pretty long.  More of the pipeline also needs to be shaken out so it works with other data sets before I can write about that.

If you want to go ahead and do it yourself then it is not particularly complex.  Details of the classification system are given in the previous blog post.   Look for Step 3.  Use the indices PE_WE_P, PHYLO_RPE_NULL2 and PHYLO_RPE2 for PE_orig, PE_alt and RPE, respectively.


Shawn Laffan 20-Nov-2014

For more details about Biodiverse, see http://purl.org/biodiverse

For the full list of changes in the 0.99 series (leading to version 1) see https://purl.org/biodiverse/wiki/ReleaseNotes

To see what else Biodiverse has been used for, see https://purl.org/biodiverse/wiki/PublicationsList


You can also join the Biodiverse-users mailing list at http://groups.google.com/group/Biodiverse-users