Saturday, 26 November 2022

Biodiverse version 4.0 has been released

We are pleased to announce the release of Biodiverse version 4.0.  

Versions for Windows, Mac and Linux (Ubuntu) are available and can be accessed via https://github.com/shawnlaffan/biodiverse/wiki/Downloads


Installation instructions are at https://github.com/shawnlaffan/biodiverse/wiki/Installation


Version 4.0 represents 52 issues closed across 752 source code commits.  260 files have been changed.

Highlights of the changes since version 3.1 are at https://github.com/shawnlaffan/biodiverse/wiki/ReleaseNotes#version-40, and the related blog posts can be accessed via https://biodiverse-analysis-software.blogspot.com/search/label/Version4

A more detailed listing of the closed issues is at https://github.com/shawnlaffan/biodiverse/milestone/17?closed=1


-----

Shawn Laffan

26-Nov-2022


For more details about Biodiverse, see http://shawnlaffan.github.io/biodiverse/  


For a list of some of the analyses Biodiverse has been used for, see https://github.com/shawnlaffan/biodiverse/wiki/PublicationsList 


You can also join the Biodiverse-users mailing list at https://groups.google.com/group/Biodiverse-users or start a discussion at https://github.com/shawnlaffan/biodiverse/discussions 


Friday, 25 November 2022

Export cluster groups to shapefile

Biodiverse Version 4 allows users to export their cluster analyses using the same grouping process as is used to colour the branches.  

This can be convenient to reconstruct the clusters in a GIS or other graphics system.  

One issue is that only the cluster polygons (or points) are exported.  If you want to attached data from the clusters then you can export them to delimited text using the Table Grouped method (with the same grouping parameters) and use a database join to attach them to the shapefile.  The main reason for this is that shapefiles have a limit of 11 characters for field names, and many indices in Biodiverse exceed this (as well as sometimes containing characters other than letters, numbers and the underscore).  

Another point to be aware of is that each group (cell) is a separate polygon so use a dissolve to merge them if you want to remove the internal boundaries.


Pictures are better than words so here are some screenshots.  


An example cluster analysis, in this case with six clusters coloured.  

The export option is in the usual place.  It can also be accessed through the outputs tab.  


In this case the export is set to use six clusters to match the display, but you can choose whatever you like.  Other options include selecting by depth or by distance from the root (by length or depth).  


And here we have a plot of the clusters.  The colours differ but the clusters themselves are the same (and one can always update the colours).   


If you want to use the grouped clusters in a spatial condition then it is easier to do so directly - see more details here.  

If you just want to replicate the display then it is better to export the spatial data to an RGB geotiff and the tree to nexus with the colours embedded - see geotiff details here and the tree details here.  


--------


Shawn Laffan

25-Nov-2022


For more details about Biodiverse, see http://shawnlaffan.github.io/biodiverse/  


To see what else Biodiverse has been used for, see https://github.com/shawnlaffan/biodiverse/wiki/PublicationsList 


You can also join the Biodiverse-users mailing list at https://groups.google.com/group/Biodiverse-users or start a discussion at https://github.com/shawnlaffan/biodiverse/discussions 


Trees: Merge single-child branches with their children

When Biodiverse is used to trim a tree to a subset of branches, for example to match the selected BaseData object, any branch with no remaining descendants is removed from the tree.  All other branches are retained.  

What this means is that some internal branches (nodes) can be left with only one child branch (node),.  These can be referred to as single-child nodes and also knuckles.  Retaining such nodes can be useful if some of the structure of the original tree needs to be kept, for example to indicate that there is phylogenetic data but that it has been removed from the tree.  The counter to this is that most phylogenetic trees are samples and so are likely to be missing many branches anyway.

In the spirit of letting the user decide, Biodiverse version 4 supports the merger of internal branches with their children if they have only one child. 

Names are important, and like many systems any node can be named in Biodiverse.  In fact, all nodes have names but internal nodes default to a number with three trailing underscores (so "1___", "35___" etc).  This allows many of the branch and clade level indices such as the phylogenetic endemism clade contributions and PD clade loss.  

The general rule when merging is that the name of the merged node is whichever node had a non-default name to begin with.  If both have non-default names then a child that is a terminal wins.  Otherwise the parent name is used.  

The process is best demonstrated using images.  


An example tree plotted using depth instead of length to show the individual branches.  The black branches are not in the basedata.  

The tree trimming interface includes the option to merge single child nodes.  In this case it is not selected.   


The black branches from the previous screenshot have been deleted but one can see several branches that appear twice as long as the others. These are actually pairs of branches.


Repeating the process above but this time merging the single child (knuckle) nodes.  


In this case all the branches are the same length because all single child branches have been merged with their children.  


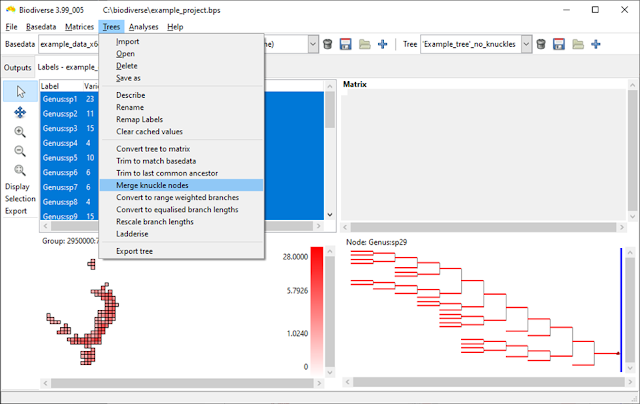
The examples above all use the tree trimming process, but if you have a tree that already has knuckles or forget to merge them then you can also merge the nodes directly from the tree menu.  


Direct access to the merging process.  

--------

Shawn Laffan

25-Nov-2022


For more details about Biodiverse, see http://shawnlaffan.github.io/biodiverse/  


To see what else Biodiverse has been used for, see https://github.com/shawnlaffan/biodiverse/wiki/PublicationsList 


You can also join the Biodiverse-users mailing list at https://groups.google.com/group/Biodiverse-users or start a discussion at https://github.com/shawnlaffan/biodiverse/discussions 


Tuesday, 25 October 2022

Biodiverse now calculates CANAPE for you

The CANAPE protocol is one of the analyses Biodiverse is most commonly used for (see examples amongst the list of publications using Biodiverse).  

The method, or protocol, was originally described in Mishler et al. (2014) and is conceptually simple.  Run an analysis that includes phylogenetic endemism and relative phylogenetic endemism, run those through a randomisation, and then categorise the results based on the significance score of the indices.  This process is described in more detail in previous posts here and here.  

The main issue with the approach to date is that the CANAPE classes are determined outside of Biodiverse using systems like a GIS, R code or a spreadsheet.  So while the process is conceptually simple, the actual implementation can all get a bit complex. Many users are not entirely sure which indices to pass through their functions, or even which lists to extract them from.  

As of Version 4 Biodiverse now calculates it for you.  This occurs automatically whenever an analysis has included the Phylogenetic Endemism and Relative Phylogenetic Endemism type 2 calculations.   (If you want it sooner than version 4 then it is in the development release 3.99_005, which was current at the time of writing.  See the downloads page for links).


Biodiverse now calculates the CANAPE scores when the requisite indices have been calculated, and a randomisation has been run.  Like many of the posts on this blog, this example uses the Acacia data set from Mishler et al. (2014).

How does Biodiverse store the results? 

The results are stored in a new list where the name is the randomisation output used followed by ">>CANAPE>>".  So for a randomisation called "rand" you would see "rand>>CANAPE>>".  The use of angle brackets might look a bit strange at first but makes the naming consistent with the other randomisation lists and simplifies the underlying code.

The CANAPE classes are stored in an index called CANAPE_CODE, with a numeric code indicating which of the categories a cell falls in.  Currently this code is 0 for not significant, 1 for neo-endemism, 2 for palaeo-endemism and 3 for mixed endemism.

Biodiverse also provides individual indices for neo, palaeo and mixed in the event a user only wants to see which cells are are in a specific class.  For example one might want to run a cluster analysis using only neo-endemism cells following the process described here.  


The same data as above but highlighting Palaeo-endemism cells in red.  All other cells containing data are in blue.  


Visualisation

A big advantage of generating CANAPE results within Biodiverse is that users can now explore the results using the functionality Biodiverse provides.  As an example, the next screen shot shows an exploration of the contribution of each clade on the tree in relation to the analysis groups (cells) (see more details about that process here and here).  

Each tree branch is coloured by the relative contribution of the clade subtending it to the PE score in the cell being hovered over (black dot in south-western WA).  This allows an understanding of which clade is driving the PE scores, and thus CANAPE, in a cell.  The visualisation process is explained in more detail here.  


Displaying the results in other systems

If you then want to use the plots as part of a map then they can be exported to an RGB Geotiff.  Details of how to do this are in another post but the next two screenshots show the start and end.  


What about a different colour scheme?


The colour scheme used is from Mishler et al. (2014) where neo is red (new is hot), palaeo is blue (old is cold) and purple is between blue and red on a colour wheel.  

If you prefer a different colour scheme then you can export the data as you normally would, for example as CSV files or as non-RGB geotiffs, and recreate the plot to your own tastes.  

Changing the colours within Biodiverse would be very useful and contributions are always welcome.

What about the Super class?  


The system does not currently generate the Super class.  It can be added if there is demand.  

Do I have to run a new randomisation analysis to see the CANAPE list?  


The CANAPE lists are generated at the end of any sequence of randomisations.  If you already have a randomisation analysis then they can be created by running one additional iteration.  

If you are concerned that your analysis is already at 999 iterations then all you lose is a bit of numeric neatness as there are now 1001 realisations in total instead of 1000 (one original plus all the random ones).  This is unlikely to make any meaningful difference once that many iterations have been run.

--------

Shawn Laffan

25-Oct-2022


For more details about Biodiverse, see http://shawnlaffan.github.io/biodiverse/  


To see what else Biodiverse has been used for, see https://github.com/shawnlaffan/biodiverse/wiki/PublicationsList 


You can also join the Biodiverse-users mailing list at https://groups.google.com/group/Biodiverse-users or start a discussion at https://github.com/shawnlaffan/biodiverse/discussions 


Sunday, 10 July 2022

Biodiverse now calculates indices for the variation in phylogenetic distinctness

Biodiverse has included calculations of indices from the phylocom system for several versions, specifically the Mean Phylogenetic Distance (MPD) and Mean Nearest Taxon Distance (MNTD).  The MPD is the average of the pair-wise distances between tree tips in a sample, where the distances pass through all the shared ancestors below the most recent common ancestor.  The MNTD is the average distance for each tip to its nearest tip in the sample.

There are many ways of slicing and diving a sample, and one of the development principles of Biodiverse is to provide more details rather than less.  Consequently there are also indices for the pair-wise root mean standard deviation (RMSD), minimum and maximum distances between a sample of tips on a tree.   

The min and max are simply the longest and shortest distances in the pairwise sample, so the distances between the most and least related pairs.  The RMSD is the square root of the mean squared distance and is a measure of the variability in a sample. It is analogous to a standard deviation but where the expected value (the mean) is zero, and follows the same formulation as the Root Mean Squared Error except a value of zero in RMSE means no error whereas in RMSD it means a zero distance between tips on the tree. 

However, the RMSD is not the variance and sometimes one is looking to see how a set of pair-wise distances is distributed around the mean.  This is where the Variance becomes useful, as first described by Warwick and Clarke (2001).

Biodiverse version 4 includes indices for the variance of the pairwise distances.  The index names are subject to change before then but for now follow the pattern PMPD1_VARIANCE, PMPD2_VARIANCE and PMPD2_VARIANCE, where the 1, 2 and 3 indicate unweighted (each tip counts equally), locally range weighted (tips count as many groups they occur in the neighbourhood) and locally abundance weighted (using the number of samples of each tip in the neighbourhood).  These are calculated by default when the relevant MPS and MNTD indices are requested. 

The variance indices are calculated with the other MPD and MNTD indices.  

Plotting is the same as for any index.  Some cells are blank because values are undefined when the sample contains only one tip, and therefore no path between tips.  Zero variances are where there are only two tips, and thus no variation.  


This is just a plot of the mean for comparison.  


But are the values significant?

A common approach to testing significance of the MPD and MNTD indices in the unweighted case is to use a resampling approach.  For each sample this generates a distribution of possible values under random resampling of the same number of tips.  More details are given in another blog post.  

The unweighted pairwise variance is also assessed in this way, with the index name using NET_VPD.  As with NRI and NTI, this is a z-score so values more extreme than +/-1.96 can be considered significantly higher or lower than expected.  

The resampling approach uses the same code as for NRI and NTI so the same sequence of resamples can be used across NRI, NTI and NET_VPD, although in Biodiverse version 4 this is only for NTI for non-ultrametric trees an exact calculation is used for NRI with any trees and for NTI for ultrametric trees.  This exact calculation avoids resampling and is much faster to run.  More details and references are in the same blog post referred to above).

The NET_VPD indices are also under the PhyloCom set.  Users can calculate the NET_VPD as well as the expected values used in its calculation.  


Values are z-scores.  At least three tips are needed to calculate the z-score as standard deviations are always zero for two tips and thus the z-score is undefined.


Control clicking on cells allow users to see the values for all indices that were calculated (within each output list, where SPATIAL_RESULTS is where most go).   


Shawn Laffan

10-Jul-2022


For more details about Biodiverse, see http://shawnlaffan.github.io/biodiverse/  


To see what else Biodiverse has been used for, see https://github.com/shawnlaffan/biodiverse/wiki/PublicationsList 


You can also join the Biodiverse-users mailing list at https://groups.google.com/group/Biodiverse-users or start a discussion at https://github.com/shawnlaffan/biodiverse/discussions 


Monday, 2 May 2022

Use clusters in spatial conditions

Spatial conditions are a core part of Biodiverse

Most people seem to focus on using single cells for their analysis and trying to find the ideal cell size.  This is missing much of the benefit of spatial analyses.  You are not constrained to using single cells in isolation.  

You can analyse regions around each focal location (processing group) using geometric shapes like circles.  Varying the size of the window gives an understanding of the spatial scale of the patterns (the operational scale).  However, there is no need to be geometric - you can use arbitrarily complex spatial conditions based on polygon features, proximity and/or matching text.  See for example Laffan and Crisp (2003) and Laity et al. (2015).  

You can also use cluster (and region grower) analyses to define your spatial windows.  These allow you to let the data define the regions, with the calculations then applied giving you more understanding of the groupings that have been identified.  Care needs to be taken with interpretation due to the risk of circularity, but that's not unusual.  And sometimes you just want to understand something about the assemblage that falls under a node (branch).  You might also be interested in the environmental properties associated with a cluster.

One issue with the cluster approach is that it can be difficult to use the branches in a spatial condition for a different analysis.  Consider the case where one wants to spatially partition a randomisation so labels are kept within their associated clusters (for a given cluster cutoff).  You could export the clusters to shapefile format, extract the relevant features to a new shapefile, and then use that in a new spatial condition.  But that's a lot of work and not easy for people less familiar with geoprocessing and GIS.  

From version 4 you can access the set of groups under a cluster analysis and use that to define spatial conditions (actually it is in the 3.99_003 development version).  This can use any of the current cutting methods, so you can slice by distance from the tips, depth, or number of clusters from the root using the sp_points_in_same_cluster condition.  You can also select individual branches (nodes) by name (sp_point_in_cluster).   

Some snippets are below that can be copied into your spatial conditions windows.  No screenshots this time, but I can add a new post of that is needed.  

Note that the cluster analysis being referred to must be in the same basedata.  


## sp_points_in_same_cluster examples

#  Try to use the highest four clusters from the root.
#  Note that the next highest number will be used
#  if four is not possible, e.g. there might be five
#  siblings below the root.  Fewer will be returned
#  if the tree has insufficient tips.
sp_points_in_same_cluster (
  output       => "some_cluster_output",
  num_clusters => 4,
)

#  Cut the tree at a distance of 0.25 from the tips
sp_points_in_same_cluster (
  output          => "some_cluster_output",
  target_distance => 0.25,
)

#  Cut the tree at a depth of 3 from the root.
#  The root is depth 1.
sp_points_in_same_cluster (
  output          => "some_cluster_output",
  target_distance => 3,
  group_by_depth  => 1,
)

#  Select four clusters below a specified node
sp_points_in_same_cluster (
  output       => "some_cluster_output",
  num_clusters => 4,
  from_node    => '118___',  #  use the node's name
)

#  target_distance is ignored if num_clusters is set
#  so this is the same as the first example
sp_points_in_same_cluster (
  output          => "some_cluster_output",
  num_clusters    => 4,
  target_distance => 0.25,
)


## sp_point_in_cluster examples

#  This will select any element that is a terminal in the cluster output
#  It is useful when the cluster analysis was run under
#  a definition query to reduce the number of elements clustered,
#  and you want the same set of elements.
sp_point_in_cluster (
  output       => "some_cluster_output",
)

#  Now specify a cluster within the output
sp_point_in_cluster (
  output       => "some_cluster_output",
  from_node    => '118___',  #  use the node's name
)

#  Specify an element to check instead of the current
#  processing element.
sp_point_in_cluster (
  output       => "some_cluster_output",
  from_node    => '118___',  #  use the node's name
  element      => '123:456', #  specify an element to check
)


Shawn Laffan

02-May-2022


For more details about Biodiverse, see http://shawnlaffan.github.io/biodiverse/  


To see what else Biodiverse has been used for, see https://github.com/shawnlaffan/biodiverse/wiki/PublicationsList 


You can also join the Biodiverse-users mailing list at https://groups.google.com/group/Biodiverse-users 


Importing group properties directly from rasters

What environmental conditions relate to my biodiversity patterns?  

Often one wants to understand which environmental conditions are associated with the taxonomic, phylogenetic and/or trait data.  Examples include edaphic and climatic variables, and publications doing so include Bickford and Laffan (2006), Gonzales-Orozco et al. (2013), González-Orozco et al. (2014a)González-Orozco et al. (2014a), Nagalingum et al. (2015) and  Bein et al. (2020).

Such data are typically obtained as rasters, with spatial resolutions often of the order of hundreds of metres.  This is in contrast to the resolution typically used for Biodiverse analyses (tens to hundreds of kilometres).

Up until now this has been something of a complex process.  The raster data need to be aggregated to the same resolution as the Biodiverse data, and aligned as part of that process.  Some sort of summary statistic needs to be calculated for each cell, usually the mean.  Then the data need to be converted to a CSV format with coordinates that exactly match the Basedata group labels so they can be attached as group properties using the import process.  The latter can be done by importing the rasters as their own basedatas, running numeric label statistics, exporting the results to CSV format and then attaching from there.  Still not simple, and not easy when there are tens of rasters to process. 

Now it is much easier

This process is greatly simplified in Biodiverse version 4, with early access via the 3.99_003 development release.  (Access to releases is via the downloads page).  

A set of rasters can be selected, imported and attached.  Biodiverse takes care of all the spatial matching and runs the summary statistics.  As a bonus, the imported data can also be attached to the project in the event the user wants to run other analyses on them.

Currently there is support for the mean, standard deviation, min, max etc.  If there is demand for other statistics like the median or inter-quartile range then these can be added.

Any raster data supported by GDAL can be imported.  Development has used geotiffs as they are the most common.  The process could probably also be generalised to support other file formats like CSV and shapefile.  It depends on demand and developer time.  

The key criteria for the raster data are that they must be in the same coordinate system as your basedata and they must represent continuous data (i.e. not be numerical categories).  The latter point is important because the group property analyses do not work with nominal/categorical values.  If you need to summarise categorical data then use an indicator approach where each class is represented by its own raster, and that raster has values of 1 for where that class occurs, and zero elsewhere.

How it works

Some screenshots are probably the best means of showing the process.  

In these examples I import two data sets from WorldClim at a 5 arc minute resolution, the Annual Mean Temperature and Mean Diurnal Range.  These are just the first two of the Bioclim layers provided by WorldClim.  The data have been projected into a Lambert Conic Conformal coordinate system to match the basedata being used (the example data that come with Biodiverse) and have been cropped to the Australian extent.


Annual rainfall from WorldClim2 for Australia, using a Lambert Conic Conformal projection.  Brown is low, blue is high.

The data are going to be attached to the example data that come with Biodiverse.

The process is accessed via the Basedata menu.

Rasters are selected from a folder at the same time as the options.  In this case the mean and standard deviation stats will be attached as properties to the the added to the selected basedata, and the intermediate basedatas will be added to the project so they can be visualised and/or analysed further.  

The process provides some general feedback when it completes (successfully or otherwise). 

The outputs tab shows the intermediate basedatas have been added.  Each contains a spatial analysis that was used to calculate the statistics.  

The property data cannot be visualised directly (yet).  To explore them without using an analysis you need to open the View Labels window for the basedata they were attached to and control click on a cell using your mouse.  


The popup window shows the properties for the cell that was clicked on (you will need to change the list being shown to be Properties).

The group properties can be analysed in a spatial or cluster analysis.  Look for the calculations starting with "Group properties" under the Element Properties set.  In this case the analyses will follow those linked to the the very top and calculate summary stats and Gi* hotspot stats for each branch in a cluster tree.    

And here is a visualisation of the Gi* hotspot stat for branches cut at 0.4744 from the tips (you can slide the blue line to change this value).  The interpretation depends on your significance threshold but Gi* scores are z-scores so, for a two-tailed test where values could be high or low, values above 1.96 are hotspots at alpha=0.05, while those below -1.96 are coldspots.      

And here are the same clusters but this time coloured by the mean stat across all groups in the sample.  (The naming scheme results in lots of "means").

And here is an example of the imported raster data (diurnal range) that were used to generate the group properties.  

This image demonstrates what can happen when coarse resolution data are used.  The 5 arc minute resolution translates to approximately 18 km when projected.  The cells in the basedata containing the species observations is 50 km.  The system uses raster cell centroid coordinates to allocate their values to a basedata cell and there are clearly alignment offsets here.  There are many sources of finer resolution data you can use.    


Shawn Laffan

02-May-2022


For more details about Biodiverse, see http://shawnlaffan.github.io/biodiverse/  


To see what else Biodiverse has been used for, see https://github.com/shawnlaffan/biodiverse/wiki/PublicationsList 


You can also join the Biodiverse-users mailing list at https://groups.google.com/group/Biodiverse-users 


Saturday, 12 March 2022

Publications using Biodiverse in 2021

2021 is now in full swing, so here is a list of publications from 2019 that used Biodiverse.


If you want to see the full list (155 at the time of writing), then go to https://github.com/shawnlaffan/biodiverse/wiki/PublicationsList


For more details about Biodiverse, see http://shawnlaffan.github.io/biodiverse/


Shawn Laffan
12-Mar-2022


Anguiano-Constante, M.A., Dean, E., Starbuck, T., Rodríguez, A. And Munguía-Lino, G. (2021) Diversity, species richness distribution and centers of endemism of Lycianthes (Capsiceae, Solanaceae) in Mexico. Phytotaxa, 514, 39-60.

Bharti, D.K., Edgecombe, G.D., Karanth, K.P. and Joshi, J. (2021) Spatial patterns of phylogenetic diversity and endemism in the Western Ghats, India: A case study using ancient predatory arthropods. Ecology and Evolution, 11, 16499-16513.

Camacho, G.P., Loss, A.C., Fisher, B.L., Blaimer, B.B. (2021) Spatial phylogenomics of acrobat ants in Madagascar—Mountains function as cradles for recent diversity and endemism. Journal of Biogeography, 48, 1706-1719.

Cheikh Albassatneh, M., Escudero, M., Monnet, A‐C., et al. (2021) Spatial patterns of genus‐level phylogenetic endemism in the tree flora of Mediterranean Europe. Diversity and Distributions, 27, 913– 928.

Earl, C., Belitz, M.W., Laffan, S.W., Barve, V., Barve, N., Soltis, D.E., Allen, J.M., Soltis, P.S., Mishler, B.D., Kawahara, A.Y., & Guralnick, R. (2021) Spatial phylogenetics of butterflies in relation to environmental drivers and angiosperm diversity across North America. iScience, 102239.

Flores-Tolentino M., Beltrán-Rodríguez L., Morales-Linares J., et al. (2021) Biogeographic regionalization by spatial and environmental components: Numerical proposal. PLoS ONE 16, e0253152.

Furtado, S.G. and Menini Neto, L. (2021) What is the role of topographic heterogeneity and climate on the distribution and conservation of vascular epiphytes in the Brazilian Atlantic Forest? Biodiversity and Conservation, 30, 1415–1431.

Garcia-Rodriguez, A., Luna-Vega, I., Yáñez-Ordóñez, O., Ramírez-Martínez, J.C., Espinosa, D., and Contreras-Medina, R. (2021). Patrones de Distribución de las Abejas del Bosque Mesófilo de Montaña de la Sierra Madre Oriental, México. Southwestern Entomologist, 46, 1021-1036.

González-Orozco, C.E. (2021) Biogeographical regionalisation of Colombia: a revised area taxonomy. Phytotaxa, 484, 3.

González-Orozco, C.E. (2021) Regiones biogeográficas del género Cinchona L. (Rubiaceae- Cinchoneae). Revista Novedades Colombianas, 16, 135-156.

González-Orozco, C. E., Sosa, C. C., Thornhill, A. H., and Laffan, S. W. (2021). Phylogenetic diversity and conservation of crop wild relatives in Colombia. Evolutionary Applications, 14, 2603-2617.

Gosper, C.R., Coates, D.J., Hopper, S.D., Byrne, M., Yates, C.J. (2021) The role of landscape history in the distribution and conservation of threatened flora in the Southwest Australian Floristic Region. Biological Journal of the Linnean Society, 133, 394–410.

Hammer, T.A., Renton, M., Mucina, L. and Thiele, K. (2021) Arid Australia as a source of plant diversity: the origin and climatic evolution of Ptilotus (Amaranthaceae). Australian Systematic Botany, 34, 570-586.

Hao, T., Elith, J., Guillera-Arroita, G., Lahoz-Monfort, J. J., & May, T. W. (2021). Enhancing repository fungal data for biogeographic analyses. Fungal Ecology, 53, 101097.

Kougioumoutzis, K., Kokkoris, I.P., Panitsa, M., Kallimanis, A., Strid, A., and Dimopoulos, P. (2021) Plant Endemism Centres and Biodiversity Hotspots in Greece. Biology, 10, 72.

Murali, G., Gumbs, R., Meiri, S. and Rull, U. (2021) Global determinants and conservation of evolutionary and geographic rarity in land vertebrates. Science Advances, 7, eabe5582.

Ortiz-Brunel, J.P., Munguía-Lino, G., Castro-Castro, A. and Rodríguez, A. (2021) Biogeographic analysis of the American genus Echeandia (Agavoideae: Asparagaceae). Revista Mexicana de Biodiversidad 92, e923739.

Paz, A., Brown, J.L., Cordeiro, C.L.O., Aguirre‐Santoro, J., Assis, C., Amaro, R.C., Raposo do Amaral, F., Bochorny, T., Bacci, L.F., Caddah, M.K., d’Horta, F., Kaehler, M., Lyra, M., Grohmann, C.H., Reginato, M., Silva‐Brandão, K.L., Freitas, A.V.L., Goldenberg, R., Lohmann, L.G., Michelangeli, F.A., Miyaki, C., Rodrigues, M.T., Silva, T.S. and Carnaval, A.C. (2021) Environmental correlates of taxonomic and phylogenetic diversity in the Atlantic Forest. Journal of Biogeography, 48, 1377-1391.

Pereira, L.C., Chautems, A. and Menini Neto, L. (2021) Biogeography and Conservation of Gesneriaceae in the Serra da Mantiqueira, Southeastern Region of Brazil. Brazilian Journal of Botany, 44, 239–248.

Pinedo-Escatel, J.A., Aragón-Parada, J., Dietrich, C.H., Moya-Raygoza, G., Zahniser, J.N. and Portillo, L. (2021) Biogeographical evaluation and conservation assessment of arboreal leafhoppers in the Mexican Transition Zone biodiversity hotspot. Diversity and Distributions, 27, 1051-1065.

Suissa, J.S., Sundue, M.A. and Testo, W.L. (2021), Mountains, climate and niche heterogeneity explain global patterns of fern diversity. Journal of Biogeography, 48, 1296-1308.

Yang, X., Liu, B., Bussman, R.W., Guan, X., et al. (2021) Integrated plant diversity hotspots and long-term stable conservation strategies in the unique karst area of southern China under global climate change. Forest Ecology and Management, 498, 119540.

Xu, M.‐Z., Yang, L.‐H., Kong, H.‐H., Wen, F. and Kang, M. (2021) Congruent spatial patterns of species richness and phylogenetic diversity in karst flora: the case study of Primulina (Gesnariaceae). Journal of Systematics and Evolution, 59, 251-261.

Xue, T., Gadagkar, S.H., Albright, T.P., Yang, X., Li, J., Xia, C., Wu, J., and Yu, S. (2021) Prioritizing conservation of biodiversity in an alpine region: Distribution pattern and conservation status of seed plants in the Qinghai-Tibetan Plateau. Global Ecology and Conservation, 32, e01885.

Zhang, Y., Chen, J. and Sun, H. (2021) Alpine speciation and morphological innovations: revelations from a species-rich genus in the Northern Hemisphere. AoB PLANTS, 13, 3, plab018.

Zhang, Y., Qian, L., Spalink, D., Sun, L., Chen, J. and Sun, H. (2021) Spatial phylogenetics of two topographic extremes of the Hengduan Mountains in southwestern China and its implications for biodiversity conservation. Plant Diversity, 43, 181-191.

Zhu, Z-X, Harris, A.J., Nizamani, M.M., Thornhill, A.H., Scherson, R.A. and Wang, H-F. (2021) Spatial phylogenetics of the native woody plant species in Hainan, China. Ecology and Evolution, 11, 2100-2109.

Publications using Biodiverse in 2020

Here is a list of publications from 2020 that used Biodiverse.  This is a long overdue post as 2020 is well past.


If you want to see the full list (155 at the time of writing), then go to https://github.com/shawnlaffan/biodiverse/wiki/PublicationsList


For more details about Biodiverse, see http://shawnlaffan.github.io/biodiverse/


Shawn Laffan
12-Mar-2022


Azevedo, J.A.R., Guedes, T.B., Nogueira, C.d.C., Passos, P., Sawaya, R.J., Prudente, A.L.C., Barbo, F.E., Strüssmann, C., Franco, F.L., Arzamendia, V., Giraudo, A.R., Argôlo, A.J.S., Jansen, M., Zaher, H., Tonini, J.F.R., Faurby, S. & Antonelli, A. (2020) Museums and cradles of diversity are geographically coincident for narrowly distributed Neotropical snakes. Ecography, 43, 328-339.

Barrera-Robles, P.H., Burgos-Hernández, M., Ruíz-Acevedo, A.D. and Castillo-Campos, G. (2020) The Linaceae family in Mexico: current status and perspectives. Botanical Sciences, 98, 560-572.

Bein, B., Ebach, M.C., Laffan, S.W., Murphy, D.J. and Cassis, G. (2020) Quantifying vertebrate zoogeographical regions of Australia using geospatial turnover in the species composition of mammals, birds, reptiles and terrestrial amphibians. Zootaxa, 4802, 61-81.

Brown, JL, Paz, A, Reginato, M, et al. (2020) Seeing the forest through many trees: Multi‐taxon patterns of phylogenetic diversity in the Atlantic Forest hotspot. Diversity and Distributions, 26, 1160-1176.

Dagallier, L.-P.M.J., Janssens, S.B., Dauby, G., Blach-Overgaard, A., Mackinder, B.A., Droissart, V., Svenning, J.-C., Sosef, M.S.M., Stévart, T., Harris, D.J., Sonké, B., Wieringa, J.J., Hardy, O.J. and Couvreur, T.L.P. (2020) Cradles and museums of generic plant diversity across tropical Africa. New Phytologist, 225, 2196-2213.

Dalrymple, R.L., Kemp, D.J., Flores-Moreno, H., Laffan, S.W., White, T.E., Hemmings, F.A. & Moles, A.T. (2020) Macroecological patterns in flower colour are shaped by both biotic and abiotic factors. New Phytologist, 228, 1972-1985.

González-Orozco, C.E., Sánchez Galán, A.A., Ramos P.E. and Yockteng, R (2020) Exploring the diversity and distribution of crop wild relatives of cacao (Theobroma cacao L.) in Colombia. Genetic Resources and Crop Evolution, 67, 2071–2085.

Huang, C., Ebach, M.C. and Ahyong, S. (2020) Bioregionalisation of the freshwater zoogeographical areas of mainland China. Zootaxa, 4742, 2.

Kougioumoutzis, K., Kokkoris, I.P., Panitsa, M., Trigas, P., Strid, A. and Dimopoulos, P. (2020) Spatial Phylogenetics, Biogeographical Patterns and Conservation Implications of the Endemic Flora of Crete (Aegean, Greece) under Climate Change Scenarios. Biology, 9, 199.

Mienna, I.M., Speed, J.D.M., Bendiksby, M., Thornhill, A.H., Mishler, B.D., Martin, M.D. (2020) Differential patterns of floristic phylogenetic diversity across a post‐glacial landscape. Journal of Biogeography, 47, 915-926.

Mishler, B.D., Guralnick, R., Soltis, P.S., Smith, S.A., Soltis, D.E., Barve, N., Allen, J.M. and Laffan, S.W. (2020) Spatial Phylogenetics of the North American Flora. Journal of Systematics and Evolution, 58, 393-405.

Moles, A.T., Laffan, S.W., Keighery, M., Tindall, M.L. and Chen, S. (2020) A hairy situation: Plant species in warm, sunny places are more likely to have pubescent leaves. Journal of Biogeography, 47, 1934-1944.

Moraes, A.M., Milward-de-Azevedo, M.A., Menini Neto, L. et al. (2020) Distribution patterns of Passiflora L. (Passifloraceae s.s.) in the Serra da Mantiqueira, Southeast Brazil. Brazilian Journal of Botany, 43, 999–1012.

Paz, A., Reginato, M., Michelangeli, F.A., Goldenberg, R., Caddah, M.K., Aguirre-Santoro, J., Kaehler, M., Lohmann, L.G. & Carnaval, A. (2020) Predicting Patterns of Plant Diversity and Endemism in the Tropics Using Remote Sensing Data: A Study Case from the Brazilian Atlantic Forest. Remote Sensing of Plant Biodiversity (eds J. Cavender-Bares, J.A. Gamon & P.A. Townsend), pp. 255-266. Springer, Cham.

Ruiz-Sanchez, E., Munguía-Lino, G., Vargas-Amado, G., Rodríguez, A. (2020) Diversity, endemism and conservation status of native Mexican woody bamboos (Poaceae: Bambusoideae: Bambuseae). Botanical Journal of the Linnean Society, 192, 281–295.

Sosa, V., Vásquez-Cruz, M. and Villarreal-Quintanilla, J.A. (2020) Influence of climate stability on endemism of the vascular plants of the Chihuahuan Desert. Journal of Arid Environments, 177, 104139.

Suissa, J.S. and Sundue, M.A. (2020) Diversity Patterns of Neotropical Ferns: Revisiting Tryon’s Centers of Richness and Endemism. American Fern Journal 110, 211–232.

Toro-Núñez, O. and Lira-Noriega, Andrés (2020) Discordant phylogenetic endemism patterns in a recently diversified Brassicaceae lineage from the Atacama Desert: When choices in phylogenetics and species distribution information matter. Journal of Biogeography, 47, 1792-1804.