What environmental conditions relate to my biodiversity patterns?
Often one wants to understand which environmental conditions are associated with the taxonomic, phylogenetic and/or trait data. Examples include edaphic and climatic variables, and publications doing so include Bickford and Laffan (2006), Gonzales-Orozco et al. (2013), González-Orozco et al. (2014a), González-Orozco et al. (2014a), Nagalingum et al. (2015) and Bein et al. (2020).
Such data are typically obtained as rasters, with spatial resolutions often of the order of hundreds of metres. This is in contrast to the resolution typically used for Biodiverse analyses (tens to hundreds of kilometres).
Up until now this has been something of a complex process. The raster data need to be aggregated to the same resolution as the Biodiverse data, and aligned as part of that process. Some sort of summary statistic needs to be calculated for each cell, usually the mean. Then the data need to be converted to a CSV format with coordinates that exactly match the Basedata group labels so they can be attached as group properties using the import process. The latter can be done by importing the rasters as their own basedatas, running numeric label statistics, exporting the results to CSV format and then attaching from there. Still not simple, and not easy when there are tens of rasters to process.
Now it is much easier
This process is greatly simplified in Biodiverse version 4, with early access via the 3.99_003 development release. (Access to releases is via the downloads page).
A set of rasters can be selected, imported and attached. Biodiverse takes care of all the spatial matching and runs the summary statistics. As a bonus, the imported data can also be attached to the project in the event the user wants to run other analyses on them.
Currently there is support for the mean, standard deviation, min, max etc. If there is demand for other statistics like the median or inter-quartile range then these can be added.
Any raster data supported by GDAL can be imported. Development has used geotiffs as they are the most common. The process could probably also be generalised to support other file formats like CSV and shapefile. It depends on demand and developer time.
The key criteria for the raster data are that they must be in the same coordinate system as your basedata and they must represent continuous data (i.e. not be numerical categories). The latter point is important because the group property analyses do not work with nominal/categorical values. If you need to summarise categorical data then use an indicator approach where each class is represented by its own raster, and that raster has values of 1 for where that class occurs, and zero elsewhere.
How it works
Some screenshots are probably the best means of showing the process.
In these examples I import two data sets from WorldClim at a 5 arc minute resolution, the Annual Mean Temperature and Mean Diurnal Range. These are just the first two of the Bioclim layers provided by WorldClim. The data have been projected into a Lambert Conic Conformal coordinate system to match the basedata being used (the example data that come with Biodiverse) and have been cropped to the Australian extent.
 |
| Annual rainfall from WorldClim2 for Australia, using a Lambert Conic Conformal projection. Brown is low, blue is high. |
 |
| The data are going to be attached to the example data that come with Biodiverse. |
 |
| The process is accessed via the Basedata menu. |
 |
| Rasters are selected from a folder at the same time as the options. In this case the mean and standard deviation stats will be attached as properties to the the added to the selected basedata, and the intermediate basedatas will be added to the project so they can be visualised and/or analysed further. |
 |
| The process provides some general feedback when it completes (successfully or otherwise). |
 |
| The outputs tab shows the intermediate basedatas have been added. Each contains a spatial analysis that was used to calculate the statistics. |
|
| The property data cannot be visualised directly (yet). To explore them without using an analysis you need to open the View Labels window for the basedata they were attached to and control click on a cell using your mouse. |
 |
| The popup window shows the properties for the cell that was clicked on (you will need to change the list being shown to be Properties). |
 |
| The group properties can be analysed in a spatial or cluster analysis. Look for the calculations starting with "Group properties" under the Element Properties set. In this case the analyses will follow those linked to the the very top and calculate summary stats and Gi* hotspot stats for each branch in a cluster tree. |
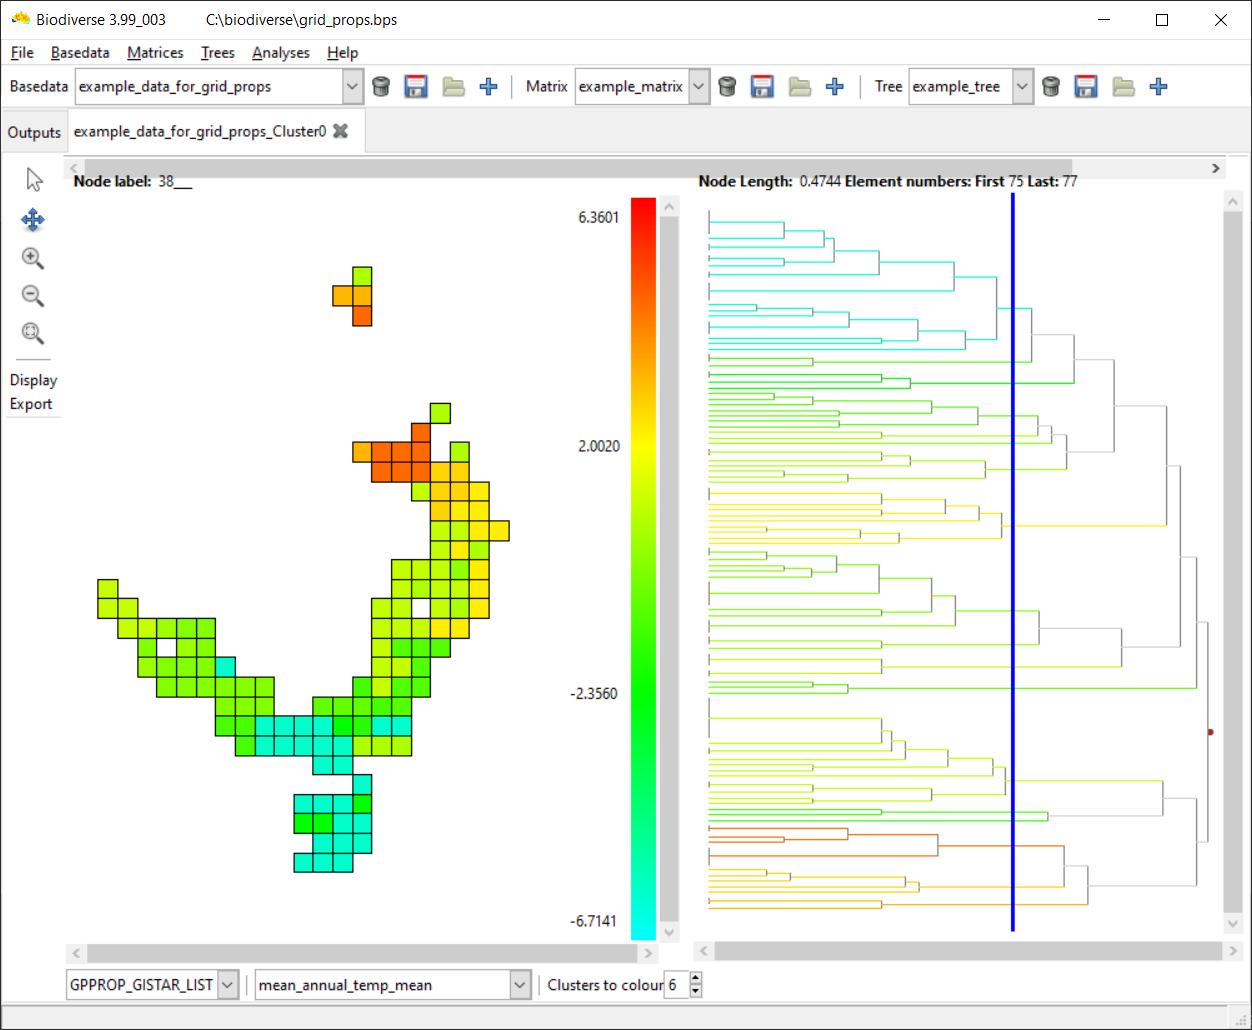 |
| And here is a visualisation of the Gi* hotspot stat for branches cut at 0.4744 from the tips (you can slide the blue line to change this value). The interpretation depends on your significance threshold but Gi* scores are z-scores so, for a two-tailed test where values could be high or low, values above 1.96 are hotspots at alpha=0.05, while those below -1.96 are coldspots. |
 |
| And here are the same clusters but this time coloured by the mean stat across all groups in the sample. (The naming scheme results in lots of "means"). |
 |
| And here is an example of the imported raster data (diurnal range) that were used to generate the group properties. |
 |
| This image demonstrates what can happen when coarse resolution data are used. The 5 arc minute resolution translates to approximately 18 km when projected. The cells in the basedata containing the species observations is 50 km. The system uses raster cell centroid coordinates to allocate their values to a basedata cell and there are clearly alignment offsets here. There are many sources of finer resolution data you can use. |
Shawn Laffan
02-May-2022
For more details about Biodiverse, see http://shawnlaffan.github.io/biodiverse/
To see what else Biodiverse has been used for, see https://github.com/shawnlaffan/biodiverse/wiki/PublicationsList
You can also join the Biodiverse-users mailing list at https://groups.google.com/group/Biodiverse-users
No comments:
Post a Comment
Note: only a member of this blog may post a comment.